Organizations now require smarter methods to lead the competition rather than traditional approaches of working harder. Every business organization pursues methods to eliminate physical work while enhancing precision levels and production rates. Organizations like yours complete many similar businesses across the world. Gartner estimates that 30% of organizations will deploy automation solutions in their business processes to achieve operational improvement through 2026.
The tool that leads this transformation is Microsoft Power Automate. This blog will provide an approach to using Power Automate integration with existing systems which transforms workflow execution through hands-on demonstrations and practical implementations.
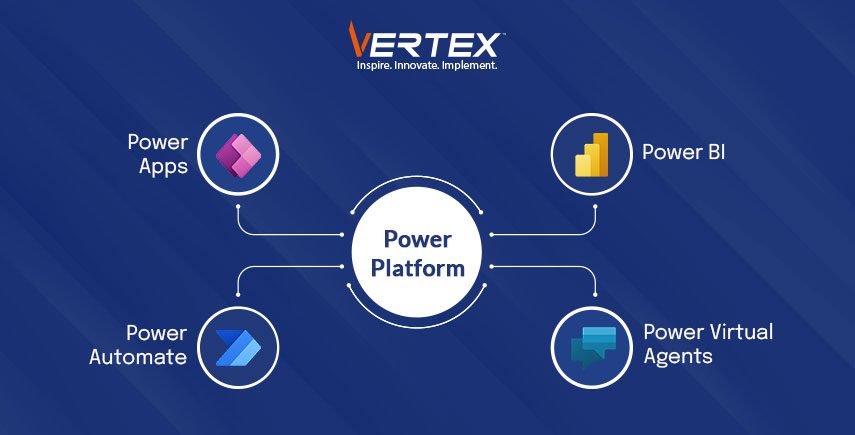
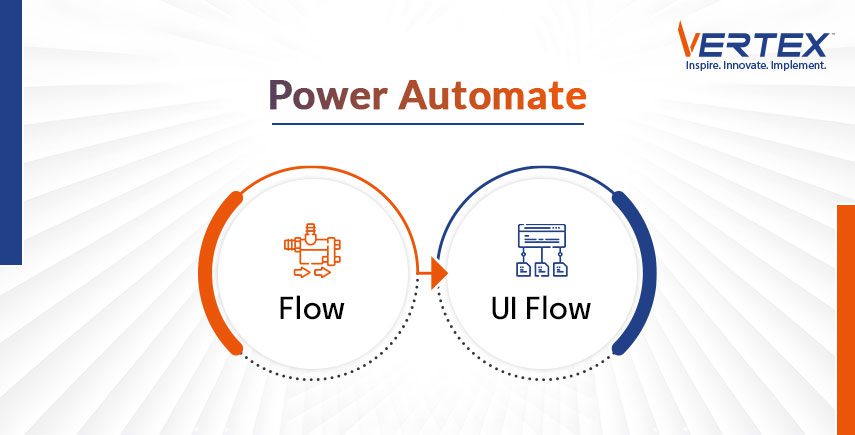
What Is Power Automate?
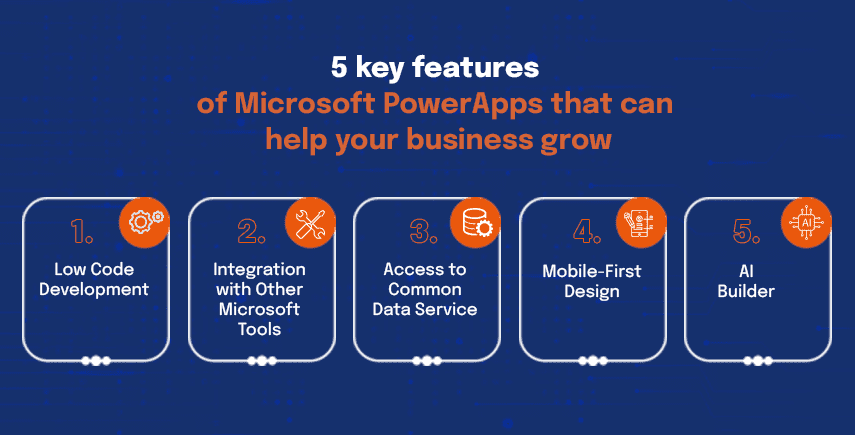
Power Automate works as a digital assistant which automates different tasks for you. The no-code/low-code Microsoft platform enables different apps and services to generate automated workflows. The workflows powered by Power Automate execute recurring operations as well as data synchronization and instant alert notifications without requiring continuous human supervision.
And the best part? You do not require technical expertise to use Power Automate. Microsoft’s Power Automate enables all users to create workflow implementations through its easy-to-use visual mapping system.
But why should you care about integrating it into your current systems? Let’s dive in.
Why Integrate Power Automate with Your Business Systems?
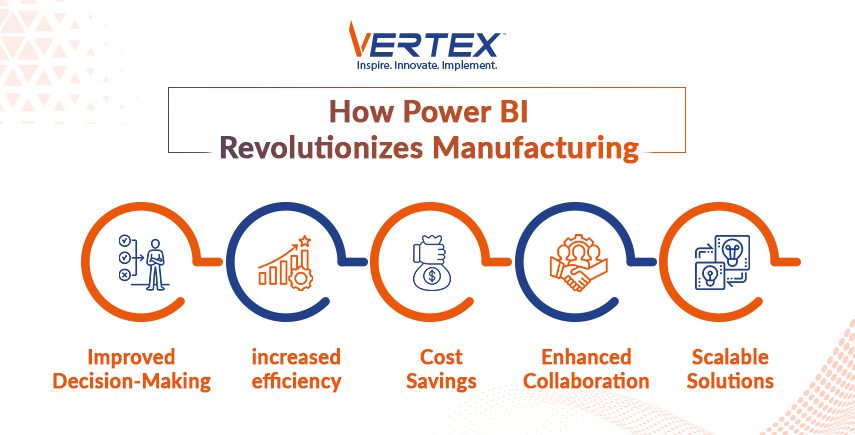
Automation represents more than a hot trend because it has become essential for every organization to succeed in this modern business environment. By integrating Power Automat, your organization will obtain the following advantages:
- Enhanced Productivity: A product enhancement through automation enables your team members to dedicate their time to critical strategic activities which advance business growth.
- Improved Accuracy: Say goodbye to human error. Virtual platforms perform data handling duties with both precision and precision in every stage.
- Cost Efficiency: Operational expenditures will decrease because automated processes reduce manual operations. Automating business processes through McKinsey standards can decrease operational expenses by 20-30%.
So, how do you get started? Your first step requires evaluating locations where automation will generate the most improvement.
Where Should You Start? Assessing Your Automation Needs
Your first step should be to determine which areas would benefit most from automation. Follow these procedures to start your work.
- Note down your process flow to find problems in your work.
- Seek tasks that repeat often with high error and slowdown rates.
- Establish your targets by stating what you want to achieve, which includes speeding up processing, decreasing errors, and enhancing customer feedback.
Once you know what to automate, it’s time to plan your integration strategy.
Planning a Successful Power Automate Integration
A basic preparation stage helps achieve better results. These steps will help you achieve a successful Power Automate implementation:
- Engage Stakeholders: Ask All Staff Members to Offer Their Employees’ Requirements and Create Support Amongst Teams
- Allocate Resources: Determine how much time, money and employees are needed to connect technologies successfully.
- Identify Risks: Find upcoming challenges and develop solutions to deal with system compatibility issues beforehand.
Now that you’re equipped with a plan, let’s explore how to implement Power Automate step by step.
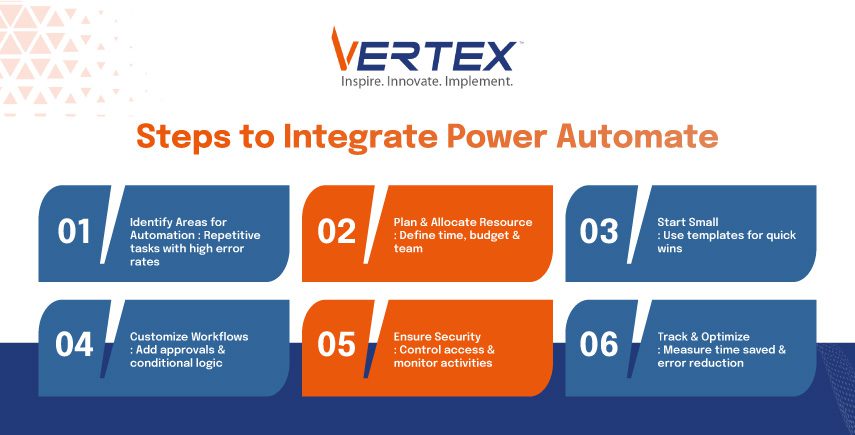
How to Integrate Power Automate with Your Systems
- Start Small: Begin with a pilot project. The simplest process to automate provides the best data to measure success.
- Use Templates: Microsoft provides numerous predefined templates in its library for you to start working with right away.
- Customize Your Workflows: Use conditional logic to direct processes and add approval rules to match your business operations.
- Prioritize Security: Secure all data by giving authorized employees access and by regularly checking system activity.
- Monitor and Optimize: Review operations regularly while looking at results to update your automation system.
Measuring the Success of Your Automation Efforts
Checking if your Power Automate integration operates correctly requires what actions? Watch the following metrics to measure success:
- Process Completion Time: How much faster are tasks completed? The automation system saves us time when tasks are completed.
- Error Rates: Are you seeing fewer mistakes and inconsistencies? Your system produces fewer errors now than before the integration.
- Employee Productivity: Are employees spending more time on strategic tasks? Members of staff focus more on leadership activities rather than daily operations.
- Cost Savings: What operational expenses have decreased since implementing automation? Report all operational expenses that were reduced when you added automation features.
Tracking these metrics helps you fine-tune your automation strategy for maximum impact.
Addressing Common Integration Challenges
Like any major change, integrating Power Automate comes with its share of hurdles. Here are some common challenges.
- Data Complexity: Handling different types of data calls for special attention. You can make data movement smooth by connecting Power Automate to external systems.
- User Adoption: Employees may refuse to accept new business system requirements. Provide personal training and show staff what Power Automate brings them.
- System Compatibility: Your existing business systems could hinder automated workflows due to incompatibility concerns. Develop a connector platform to connect different systems.
- Security Concerns: When automating processes, security issues arise that threaten personal data integrity. A secure system environment needs proper access restrictions plus regular monitoring of workflow activities.
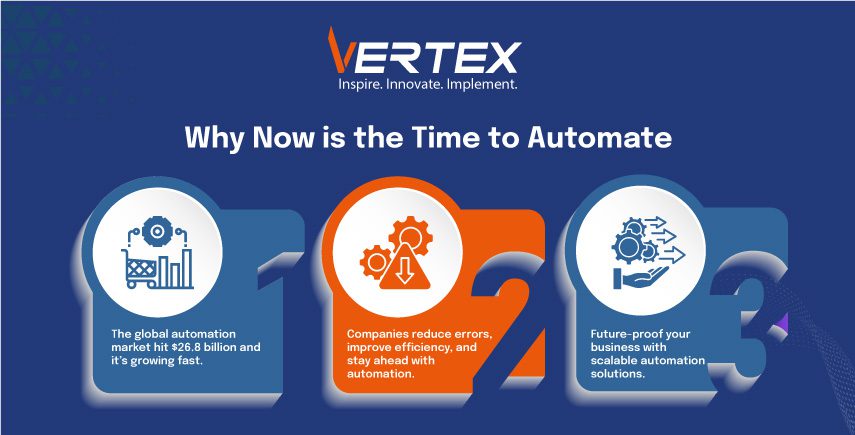
Why Now Is the Time to Embrace Automation
AI and automated software solutions hit USD 26.8 billion in global markets, according to a report. So, yes, it is going to spread, and when you start using Power Automate today, you will surely receive these benefits first:
- Prove your business ahead of others while disabling mistakes within your workflow.
- Deliver strong and unique customer experiences by responding faster to their needs.
- Make your business adaptable by adding automation tools that can expand as your operations grow.
Wrapping Up
Using Power Automate as a company represents more than a wise decision because it serves as an essential strategy to maintain competitiveness within digital environments. You can have advanced levels of operational efficiency and innovation.
Learn how VertexCS will direct your automation path and assist in business process optimization for current needs.