Manish Bharti
November 25, 2024Insights and Analytics in Azure DevOps: Making Data-Driven Decisions
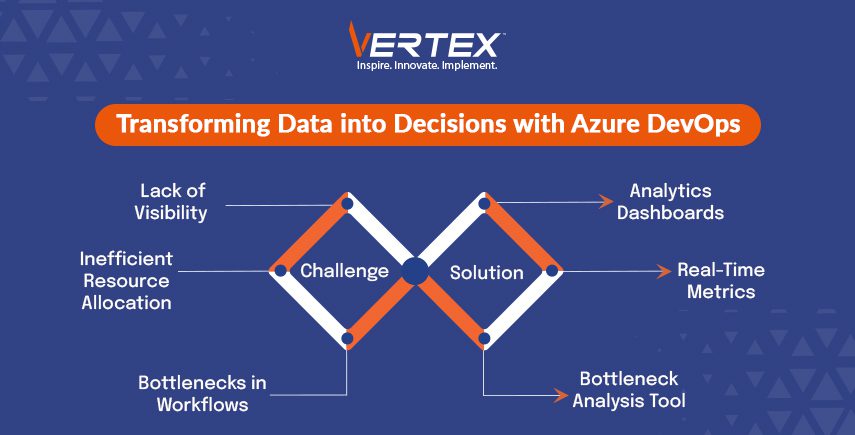
Modern software development is increasingly complex, involving multiple teams, pipelines, and deliverables, often under tight deadlines. Companies frequently struggle with:
- Lack of visibility into project health and performance.
- Inefficient resource allocation due to incomplete or outdated data.
- Missed deadlines stemming from unforeseen bottlenecks in workflows.

To tackle these challenges, organizations need clear, actionable insights—insights that turn complex data into meaningful decisions. That’s where Azure DevOps steps in. With its comprehensive and integrated platform, Azure DevOps simplifies the process, empowering teams to make smarter, data-driven decisions at every stage of the software delivery lifecycle.
This article dives into the depth of Insights and Analytics in Azure DevOps, exploring how to utilize its capabilities to optimize workflows, improve performance, and meet business goals.
Why Analytics Matter in Azure DevOps
Azure DevOps provides an environment where teams collaborate on code, manage work items, and deploy applications. However, without actionable insights, teams often operate in silos, with minimal visibility into metrics like:
- Work item completion rates.
- Pipeline efficiency and bottlenecks.
- Test coverage and failure rates.
- Code quality trends over time.
Analytics transform raw data from these processes into meaningful visualizations and metrics. These insights allow stakeholders to monitor progress, identify risks, and take proactive measures to ensure project success.

Key Analytical Features in Azure DevOps
Azure DevOps offers several tools and features that provide analytics and reporting capabilities.
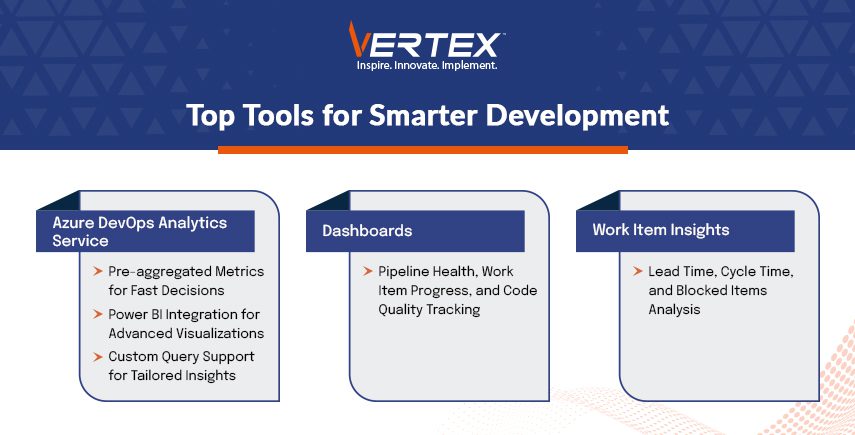
- Azure DevOps Analytics Service
The Azure DevOps Analytics Service is the backbone for insights in Azure DevOps. Built for scalability and performance, it aggregates data from various sources within Azure DevOps and enables fast querying for reports and dashboards.Core features of the Analytics Service include:- Pre-aggregated Metrics: Reduces query time by pre-processing key metrics like deployment frequency, lead time, and mean time to recover (MTTR).
- Integration with Power BI: Enables advanced data visualization and custom reporting.
- Custom Query Support: Allows users to define and analyze metrics specific to their project needs.
- Built-In Dashboards
Azure DevOps offers out-of-the-box dashboards that provide real-time insights into various aspects of your projects. These dashboards include widgets for:- Pipeline Health: Displays build success/failure rates, average duration, and pipeline utilization.
- Work Item Progress: Tracks sprint velocity, backlog health, and burndown rates.
- Code Quality: Highlights code coverage trends, technical debt, and pull request activity.
These dashboards can be tailored to suit individual roles, ensuring developers, project managers, and leadership each get the insights they need.
- Work Item Insights
Work Item Analytics focus on tracking tasks, bugs, and features. Key metrics include:- Lead Time: Time taken for a work item to move from creation to completion.
- Cycle Time: Time taken for a work item to move between two workflow stages, such as “In Progress” to “Done.”
- Blocked Work Items: Identifies bottlenecks that may hinder delivery.
Advanced Analytics with Power BI
Azure DevOps Analytics integrates seamlessly with Power BI, allowing teams to create custom, interactive reports. This capability is essential for organizations needing detailed, cross-project insights or reporting for leadership.
Setting Up Power BI Integration
- Enable the Analytics Service in your Azure DevOps organization.
- Use the Power BI Data Connector to link Azure DevOps data to Power BI.
- Build custom queries in Power BI using the Analytics Service as the data source.
Sample Use Cases for Power BI in Azure DevOps
- Team Productivity: Visualize trends in sprint velocity to assess whether teams are meeting their commitments.
- Delivery Timelines: Track lead time and cycle time metrics to evaluate delivery efficiency.
- Quality Trends: Correlate test pass/fail rates with defect rates to understand the impact of code changes on product stability.
Making Data-Driven Decisions in Azure DevOps
Analytics in Azure DevOps empower teams to make informed decisions at various stages of the software delivery lifecycle. Below are some examples of how teams can use these insights effectively.
- Optimizing Pipelines
- Bottleneck Identification: Use pipeline metrics to find stages with high failure rates or long execution times.
- Parallelization Opportunities: Analyze build and release timelines to identify areas where tasks can run in parallel, reducing overall cycle time.
- Testing Strategy Evaluation: Monitor test pass rates and identify flaky or redundant tests that waste pipeline resources.
- Improving Code Quality
- Technical Debt Tracking: Monitor trends in static code analysis results to prioritize refactoring efforts.
- Pull Request Insights: Use analytics to measure code review time and ensure critical changes receive adequate attention.
- Bug Correlation: Analyze defect density and associate it with specific modules or teams to identify areas needing improvement.
- Managing Team Workloads
- Capacity Planning: Analyze sprint velocity and workload distribution to ensure teams are neither overburdened nor underutilized.
- Blocked Work Items: Regularly review blocked tasks to mitigate risks of delay.
- Cross-Team Dependencies: Use dependency tracking to coordinate between teams and avoid conflicting priorities.
- Monitoring Deployment Health
- Deployment Frequency: Evaluate whether frequent deployments align with business goals, such as faster time-to-market.
- Failure Rates: Track deployment success rates and correlate failures with specific pipeline changes.
- MTTR (Mean Time to Recover): Use incident analytics to understand how quickly teams can resolve deployment issues.

Best Practices for Implementing Insights and Analytics in Azure DevOps
- Start with Clear Goals
Define what metrics are most critical to your organization. For instance, a company focused on rapid innovation may prioritize lead time and deployment frequency, while another may emphasize code quality. - Use Pre-Built Dashboards First
Leverage Azure DevOps’ built-in dashboards to quickly gain initial insights. These are designed to cover the most commonly needed metrics. - Automate Data Collection
Enable the Analytics Service and integrate Power BI to ensure all metrics are up-to-date without manual intervention. - Iterate on Metrics
Regularly review your analytics setup to ensure metrics remain relevant. Add, remove, or adjust metrics as project priorities evolve. - Train Your Teams
Ensure team members understand how to interpret dashboards and use analytics to drive decisions. Provide training on tools like Power BI for more advanced users.
Challenges and How to Overcome Them
Despite its robust capabilities, using analytics in Azure DevOps can present some challenges:
- Data Overload: Too many metrics can overwhelm teams. Focus on a handful of actionable KPIs.
- Siloed Reporting: Ensure all teams use the same data sources and definitions to avoid discrepancies in reports.
- Custom Query Complexity: For advanced reports, building custom queries in Power BI can be complex. Consider leveraging templates or consulting experts.
Empower Your Azure DevOps Strategy with Vertex
At Vertex Consulting Services, we’re passionate about helping organizations like yours harness the full power of Azure DevOps analytics. Our solutions are designed with your success in mind, focusing on what matters most:
- Custom Dashboards Tailored to You: Get insights that truly align with your goals, helping you make smarter, faster decisions.
- Power BI Integration Made Simple: Turn your data into clear, actionable visualizations that keep your teams and stakeholders on the same page.
- Expert Support Every Step of the Way: From best practices to advanced analytics, we make sure you’re set up for long-term success.
When you partner with Vertex, you’re not just getting a service provider—you’re getting a dedicated ally to simplify the complexities of Azure DevOps. We’ll help you uncover bottlenecks, improve workflows, enhance code quality, and consistently hit your deadlines.
Conclusion
Azure DevOps’ Insights and Analytics features are game-changers for software development teams, providing the tools you need to make smarter, data-driven decisions. With built-in dashboards, the Analytics Service, and Power BI integration, you can streamline pipelines, boost code quality, and empower your teams to work more efficiently.
When done right, these insights help align your development processes with your big-picture goals, ensuring your organization delivers high-quality software on time and within budget.
Let’s work together to take your Azure DevOps strategy to the next level. Visit Vertex Consulting Services today and see how we can help you achieve smarter, faster, and more reliable results.
Recent Blogs

19 May, 2025

19 May, 2025

12 May, 2025

5 May, 2025

28 April, 2025

21 April, 2025

14 April, 2025

7 April, 2025
Recent News

2 February, 2025

14 November, 2024

4 November, 2024

1 August, 2024

6 March, 2024

28 February, 2024

12 June, 2023


