

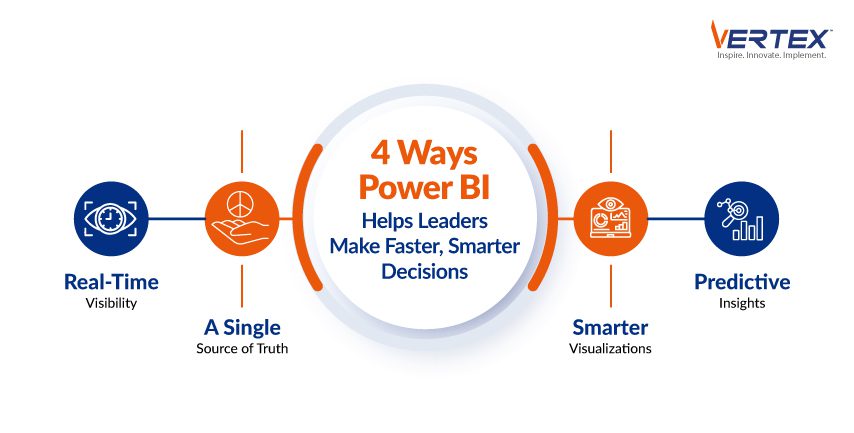
4 Ways How Power Bi Helps Leaders Make Faster, Smarter Decisions
- Real-Time Visibility: Traditional reports take days to compile and are outdated by the time they are ready — Power BI delivers live dashboards so leaders can monitor KPIs as they happen.
- One Version of the Truth: Power BI unifies CRM, ERP, finance, and operational data into a single analytics environment, eliminating the confusion of conflicting numbers across departments.
- Insights Anyone Can Read: Interactive charts, heat maps, and trend lines replace complex spreadsheets, making it faster to spot patterns, outliers, and emerging risks.
- From Reactive to Proactive: Power BI’s predictive analytics capabilities help leaders forecast revenue, demand fluctuations, and operational risks before they become costly problems.
- Proven Vertex Expertise: With 50+ analytics projects and 1,000+ dashboards delivered, Vertex helps organizations adopt Power BI in a way that drives measurable business outcomes, not just better-looking reports.
In today’s business environment, speed and accuracy of decision-making can determine whether organizations stay ahead of the competition or struggle to keep up.
Leaders are expected to make strategic decisions quickly.
However, at times, those decisions have to be taken with incomplete or fragmented information.
Data exists across systems such as CRM, ERP, finance platforms, marketing tools, and operational databases.
But without a unified view, decision-making becomes slow, reactive, and sometimes inaccurate.
This is where Microsoft Power BI plays a critical role.
Power BI helps organizations transform raw data into real-time insights that support faster, more informed decisions.
Let’s explore four key ways Power BI enables leaders to make smarter decisions.
Real-Time Visibility into Business Performance
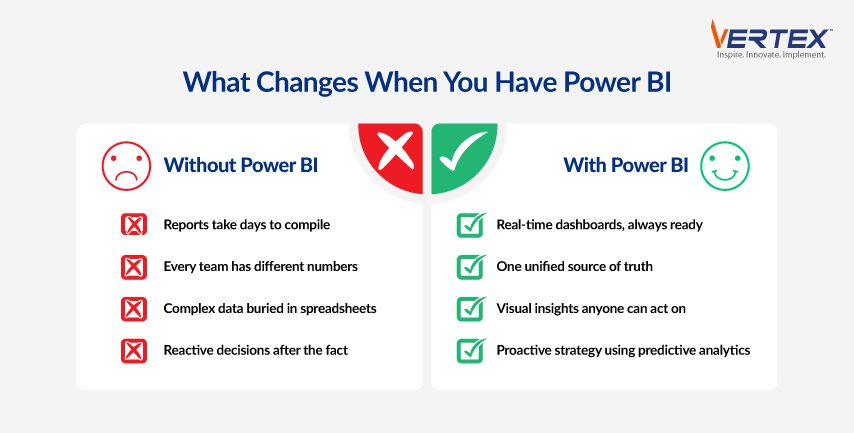
Traditional reporting processes often involve manually compiling data from multiple systems, which can take days or even weeks.
By the time reports are ready, the information may already be outdated.
Power BI connects directly to multiple data sources and provides real-time dashboards that allow leaders to monitor key performance indicators (KPIs) continuously.
For example:
- A sales leader can monitor daily revenue performance across regions
- A supply chain manager can track inventory levels in real time
- A finance leader can view cash flow trends instantly
When leaders have access to real-time data, they can respond faster to market changes, operational risks, and customer needs.
A Single Source of Truth across Departments
One of the biggest barriers to effective decision-making is inconsistent data across departments.
Sales teams may rely on CRM dashboards.
Finance teams depend on ERP reports.
Operations teams use separate tools.
Each system may present slightly different numbers, leading to confusion and delays.
Power BI integrates data from multiple systems into a unified analytics environment, creating a single source of truth.
According to Gartner, poor data quality costs organizations an average of $12.9 million annually, often due to inconsistent or fragmented data environments.
With a unified view of business metrics, leaders spend less time reconciling data and more time acting on insights.
Advanced Data Visualization Simplifies Complex Insights
Large datasets often contain valuable insights, but interpreting raw numbers can be difficult and time-consuming.
Power BI uses interactive visualizations such as charts, heat maps, trend lines, and performance indicators to make complex information easier to understand.
Instead of reviewing lengthy spreadsheets, leaders can quickly identify:
- Trends
- Patterns
- Outliers
- Opportunities
- Risks
For example, a retail company can visually identify declining product demand across specific locations and adjust inventory strategies accordingly.
Clear visual insights reduce cognitive load and accelerate decision-making.
Predictive Insights Enable Proactive Decision-Making
Beyond historical reporting, Power BI supports predictive analytics capabilities that help leaders anticipate future trends.
By analyzing historical data patterns, organizations can forecast:
- Revenue trends
- Customer demand fluctuations
- Operational risks
- Budget requirements
- Resource utilization
Predictive insights enable leaders to shift from reactive decision-making to proactive strategy.
Turning Data into Strategic Advantage
Organizations today generate massive amounts of data, but data alone does not create value.
The real advantage comes from transforming data into timely, relevant insights that guide strategic decisions.
Power BI enables leaders to:
- Access real-time performance metrics
- Align teams around consistent data
- Understand trends through intuitive visualization
- Anticipate future outcomes through predictive insights
At Vertex, we help organizations unlock the full potential of Microsoft Power BI by transforming fragmented data into meaningful, decision-ready insights.
Our capabilities span the entire Power BI lifecycle from data extraction and transformation using Power Query, robust data modeling, and advanced DAX calculations, to intuitive dashboard development, custom visualizations, and embedded analytics within business applications.
With a proven track record of delivering 50+ data analytics and Power BI visualization projects and 1,000+ dashboards and insights, Vertex focuses strongly on driving adoption so that insights translate into measurable business outcomes.
If your organization is struggling with fragmented data or slow reporting cycles, it may be time to rethink your analytics strategy.
Connect with our team today to explore how Power BI can help transform your data into a competitive advantage.
Recent Blogs

1 May, 2026

24 April, 2026

17 April, 2026

10 April, 2026

3 April, 2026
27 March, 2026

20 March, 2026
13 March, 2026
Recent News

26 February, 2026

6 December, 2025

1 August, 2025

2 February, 2025

14 November, 2024

4 November, 2024

1 August, 2024

6 March, 2024
