The Ethical Implications of Data Analytics: A Deep Dive

Data analytics has become the backbone of decision-making for businesses across industries. IT Managers, CIOs, Digital Transformation Leaders, and Business Executives increasingly rely on data to optimize operations, enhance customer experiences, and drive growth. However, as data usage grows, so do concerns about its ethical implications.

In this article, we explore the ethical challenges of data analytics and their broader impact on businesses and society.

The Power of Data Analytics

Data analytics has made it possible for businesses to predict trends, optimize operations, and personalize customer experiences in real-time. Previously, companies relied on limited data and tools, but today’s advanced analytics allow for faster, more accurate insights, driving innovation and efficiency. This transformation empowers businesses to make data-driven decisions at a scale and speed previously unimaginable, but it also brings new ethical responsibilities to ensure responsible data use.

key

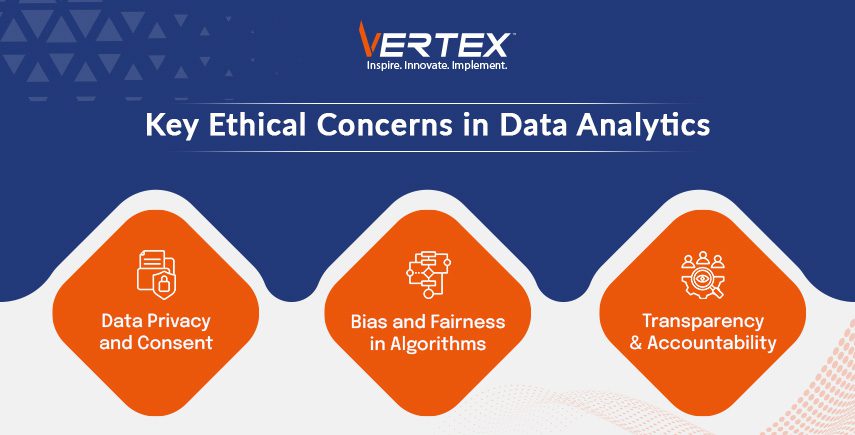
Ethical Concerns in Data Analytics 

  1. Data Privacy and Consent
    A major ethical concern in data analytics is data privacy. Businesses must comply with stringent privacy laws governing the collection, storage, and use of personal data. This includes regulations like the GDPR in Europe, the CCPA in California, and India’s newly implemented Digital Personal Data Protection Act (DPDP Act) of 2023.
    These laws require businesses to obtain informed consent from individuals before using their data and ensure its protection throughout the process. Failure to comply with these regulations or mishandling personal data can result in severe legal consequences and damage to a company’s reputation, making it essential for organizations to prioritize transparent and responsible data practices globally.
  2. Bias and Fairness in Algorithms
    Data-driven algorithms play a significant role in decision-making, but they are not immune to bias. If the data used to train algorithms is biased, the results can perpetuate systemic inequalities. A well-known example involves facial recognition technology, which has been criticized for higher error rates in identifying people of color. This bias can lead to unfair treatment in industries like hiring, lending, and law enforcement.
    To avoid this, organizations must regularly audit their algorithms and ensure diverse data sets are used in training models. Fairness in AI and data analytics should be a priority to avoid discriminatory outcomes.
  3. Transparency and Accountability
    As data analytics becomes more complex, it can be difficult for stakeholders to understand how decisions are made based on data. Lack of transparency can breed distrust, especially when decisions have significant consequences. Accountability is equally crucial. Organizations must be clear about who is responsible for decisions made by data-driven systems. When ethical issues arise, there should be clear lines of accountability to address and correct them.

best

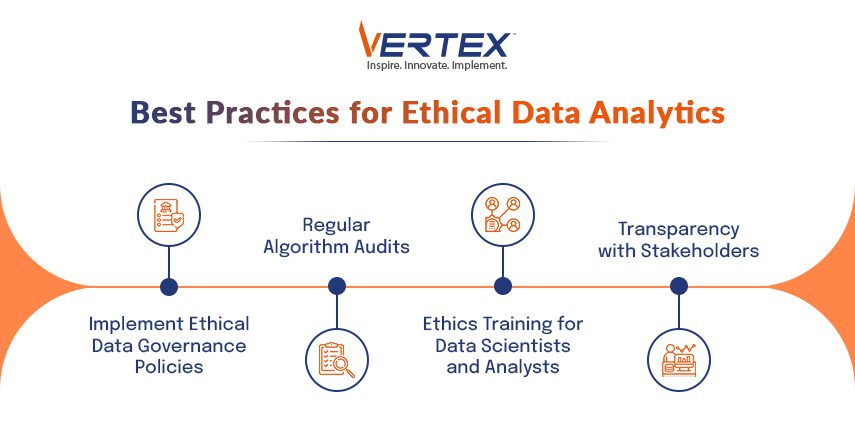
Ethical Best Practices for Businesses

  1. Implement Ethical Data Governance Policies
    To ensure that data analytics practices are ethical, organizations need to develop robust governance policies. These policies should outline how data is collected, stored, and used while prioritizing privacy, consent, and fairness.
  2. Regular Algorithm Audits
    As highlighted earlier, bias in algorithms can have serious ethical implications. Regular audits and updates to data models can help mitigate bias and ensure fairness. IT Managers and Data Scientists should work together to maintain the integrity of these systems.
  3. Transparency with Stakeholders
    Clear communication with stakeholders—including customers, employees, and partners—is essential to building trust. Organizations should be transparent about how they use data, the purpose behind their analytics initiatives, and the steps they take to protect privacy.
  4. Ethics Training for Data Scientists and Analysts
    The individuals responsible for working with data should be trained in ethical considerations. This can help them make informed decisions and avoid common pitfalls in data ethics.

The Future of Ethical Data Analytics

The future of data analytics depends on how well organizations manage the ethical challenges associated with its use. By implementing policies that prioritize transparency, fairness, and privacy, businesses can harness the full potential of data analytics without compromising their ethical standards. Data-driven decision-making will continue to be a critical tool in driving business success, but it must be tempered by responsible and ethical practices.

Vertex CS, as a leader in digital transformation, advocates for the ethical use of data analytics in driving business growth and operational excellence. As businesses continue to leverage data for innovation, the ethical implications must remain at the forefront of every strategy.
Beyond Numbers: How data visualization can tell a powerful story

Numbers might confuse many, but pictures don’t. When discussing data, a lot of people become apprehensive, thinking it’s akin to rocket science. However, with the help of data visualization, the entire process becomes easier. According to MIT, 90% of the information transmitted to our brains is visual. Through the practice of data visualization, one can transform ordinary pieces of data into visual objects such as maps, graphs, or Venn diagrams.

Details about data visualisation

One of the phases in the data science process is data visualization, which asserts that conclusions can only be drawn from data that has been gathered, processed, and modeled. Additionally, data visualization is a component of the larger field of data presentation architecture (DPA), which aims to efficiently identify, locate, manipulate, format, and deliver data.

Visualization is essential for advanced analytics. It becomes crucial to visualize the outputs when a data scientist is developing sophisticated machine learning (ML) or predictive analytics algorithms to track outcomes and ensure the models are operating as intended. This is because complex algorithm visualizations are typically easier to understand than their numerical results.

Benefits of data visualization

Benefits-of-data-visualization

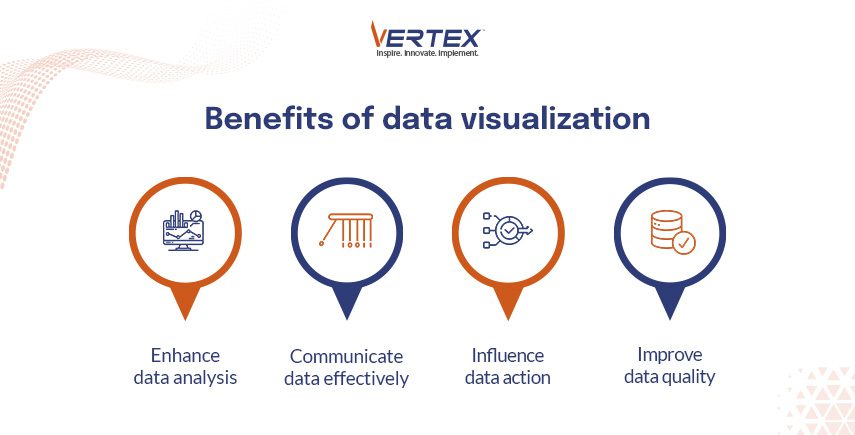
1. Enhance data analysis: Enhancing your data analysis and interpretation is a significant advantage of data visualization. A variety of visualization techniques, including histograms, scatter plots, heat maps, and treemaps, can help uncover distributions, patterns, and correlations in your data that might otherwise go undetected or unnoticed. Additionally, data visualization allows you to zoom into specifics or zoom out to the big picture while exploring various facets and viewpoints of your data. This helps to get more profound data insights.

2. Communicate data effectively: Effective data communication to your audience is important, whether it is your team, your clients, or your stakeholders. You can highlight the most important points, accentuate the primary messages, and use visual elements such as colors, shapes, icons, and labels to tell an engaging story with your data. Additionally, you can use data visualization to make technical or complicated data easier to understand and more interesting for your audience. In this way, you can communicate your data effectively and clearly.

3. Influence data action: The ability of data visualization to influence your actions and results is a significant advantage. You can persuade your audience to act based on your data by using data visualization to both inform and educate them. Data visualization can illustrate the advantages, disadvantages, opportunities, and difficulties associated with various options and suggest the best course of action. Additionally, data visualization can track and evaluate the outcomes of your actions and make necessary adjustments. By doing this, you can maximize the use of data in your decision-making and achieve your objectives. The Wharton School of Business discovered that when visuals were included, the percentage of audience members who were persuaded increased to over two-thirds from just half in a verbal presentation.

4. Improve data quality: One of the benefits of data visualization is that it can help you improve the quality and accuracy of your data. By visualizing your data, you can spot errors, outliers, inconsistencies, and missing values more easily, and correct them before they affect your analysis. You can also use data visualization to validate your assumptions, test your hypotheses, and compare different scenarios. This way, you can ensure that your data is reliable and relevant for your decision-making.

How data visualisation can tell a powerful story?

powerful-story

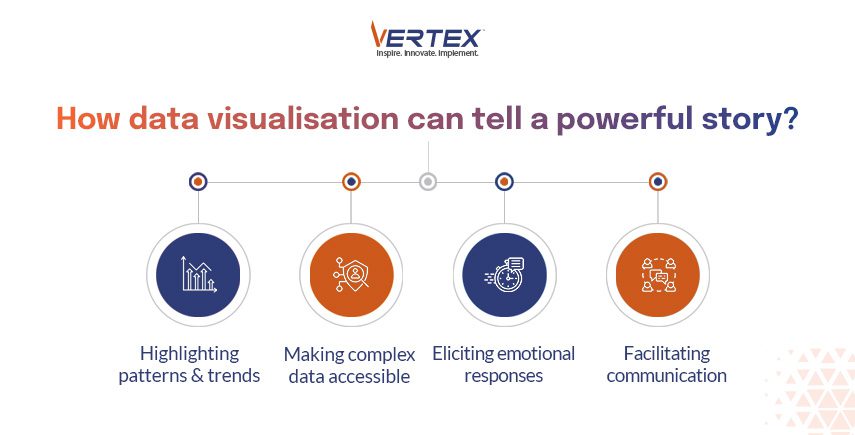
1. Highlighting patterns and trends: Data visualization can reveal patterns and trends in data that might not be immediately apparent from raw numbers alone. Whether it’s an upward trajectory in sales over time or a correlation between variables, visualizations make these insights clear and compelling.

2. Making complex data accessible: Complex datasets can be difficult to understand at a glance. Visualizations simplify complexity by presenting data in a format that is easy to interpret, allowing audiences to grasp key insights quickly. Additionally, for assistance with data management, you can opt for the services of Vertex.

3. Eliciting emotional responses: Well-crafted visualizations have the power to evoke emotions and provoke reactions. Whether it’s shock at seeing the scale of a problem or inspiration from observing progress over time, visualizations can engage audiences on a deeper level than raw data alone.

4. Facilitating communication: Visualizations serve as a universal language that transcends barriers such as language or technical expertise. They enable effective communication of complex ideas and concepts to diverse audiences, fostering understanding and collaboration.

Conclusion

In conclusion, data visualization is a powerful tool that can transform complex data sets into easily digestible narratives. By leveraging the human brain’s natural affinity for visual information, data visualization empowers us to uncover patterns, enhance communication, and ultimately, make data-driven decisions.

Vertex offers a comprehensive suite of data management services that can help you clean, organize, and prepare your data for visualization. With Vertex by your side, you can unlock the hidden stories within your data and transform them into actionable insights.

Contact Vertex today to learn more about how our data management solutions can empower your data visualization journey.

Predict trends and behaviour with advanced analytics, the future of business intelligence

In the current economic situation, it is more crucial than ever for firms to maintain a competitive advantage over their competitors. In order to successfully accomplish this goal, it is necessary to harness the power of advanced analytics and integrate it into the fundamental aspects of business intelligence initiatives. The rise of the business intelligence (BI) industry, expected to reach a value of $33.3 billion by the year 2025, is being driven by the numerous capabilities offered by BI tools.

What does the future hold for business intelligence? Let’s take a closer look and find out.

The Evolution from Descriptive to Predictive and Prescriptive Analytics

Traditionally, business intelligence (BI) focused on descriptive analytics, providing a rearview mirror perspective on business operations through dashboards and reports. However, the advent of advanced analytics has shifted this paradigm towards predictive and prescriptive analytics.


Predictive analytics employs statistical models and machine learning algorithms to forecast future trends based on historical data. Prescriptive analytics goes a step further by not only predicting outcomes but also recommending actions to achieve desired objectives.

The integration of these advanced analytics into BI tools has enabled businesses to anticipate market changes, understand customer behavior with greater precision, and optimize operational efficiency. For instance, machine learning models can analyze customer purchase history and social media activity to predict future buying behaviors and preferences. This foresight allows businesses to tailor their marketing strategies proactively, ensuring they meet the customer at their point of need.

Leveraging Big Data and Real-Time Analytics

The exponential growth of data structured and unstructured has necessitated the adoption of sophisticated data management and analysis techniques.


Big Data technologies, such as Hadoop and Spark, facilitate the storage, processing, and analysis of vast datasets that traditional BI tools would find cumbersome to handle. When combined with real-time analytics, businesses can monitor operations in real-time, identify trends as they happen, and make informed decisions promptly.

For industries like retail, finance, and healthcare, where timing can significantly impact outcomes, the ability to react to real-time data can be a game-changer.

The Role of Artificial Intelligence and Machine Learning

Artificial Intelligence (AI) and Machine Learning (ML) are at the heart of the transformative power of advanced analytics. AI algorithms can automate complex analytical processes, learn from data patterns, and make decisions with minimal human intervention. This automation and intelligence are pivotal in scenarios where the volume, velocity, and variety of data exceed human analytical capabilities.


In predictive maintenance, for example, AI-driven systems analyze data from machinery sensors to predict failures before they occur, saving companies from expensive downtime and repair costs.

Similarly, in the realm of customer service, chatbots powered by AI can handle a multitude of customer inquiries simultaneously, providing quick and accurate responses, and improving overall customer satisfaction.

Integrating Advanced Analytics into Business Strategy

For businesses to fully leverage the potential of advanced analytics, it’s imperative to integrate these technologies into their overarching business strategy. This integration requires a shift in mindset, from viewing data as a by-product of business operations to considering it a valuable asset that can drive strategic decisions.


A critical aspect of this integration is fostering a data-driven culture within the organization. This involves training employees to utilize data in their decision-making processes, ensuring the quality and accessibility of data across departments, and investing in the right tools and technologies that align with the business’s strategic objectives.

The Future Is Now

The intersection of advanced analytics and business intelligence represents a frontier of limitless possibilities. Businesses that successfully navigate this intersection will not only stay ahead in their respective industries but also redefine what is possible in their domains.

For organizations looking to harness the transformative power of advanced analytics in their BI strategies, partnering with a specialized entity that possesses deep expertise and a comprehensive suite of services in this domain is crucial. Such a partnership can accelerate the journey towards becoming a truly data-driven organization, capable of predicting trends, optimizing operations, and delivering unparalleled value to customers.

Partner with us at Vertex, where our state-of-the-art services in data analytics, AI, and business intelligence solutions are tailored to propel your business towards unprecedented growth and efficiency. Our expertise is your leverage in navigating the complexities of the digital era. Connect with us today, and let’s transform your data into your most strategic asset.

How Foot Traffic Analysis Makes Every Step Count in Retail

Every customer who enters your store is an opportunity, but are you making the most of it? Foot traffic analysis in retail is a vital metric, reflecting the number of customers visiting a store. This analysis is crucial for retailers as it directly correlates to potential sales and customer engagement.

By tracking foot traffic, retailers gain insights into customer behaviour, enabling them to tailor their strategies for maximum efficiency. Leveraging this data impacts critical decision-making in areas like marketing, store layout, and staffing, ultimately driving retail success.

Methods for Tracking Foot Traffic

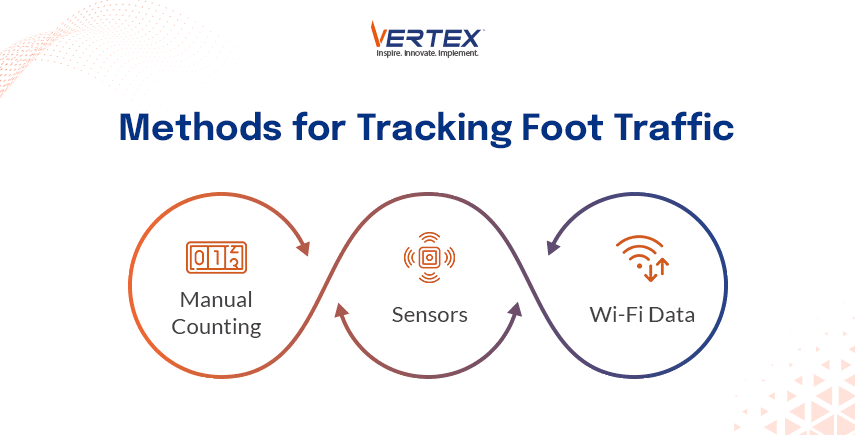
  • Manual Counting: This traditional method involves counting customers as they enter and leave the store. It’s cost-effective but can be prone to errors.
  • Sensors: Retailers are increasingly using sensors, including thermal or infrared sensors, for more accurate foot traffic data. These sensors track the movement of customers as they navigate through the store.
  • Wi-Fi Data: Wi-Fi tracking is another modern method where foot traffic data is collected when customers connect to the store’s Wi-Fi network. It offers insights into new versus returning customers.

Effectively tracking and analyzing foot traffic data, retailers can optimize store staffing, improve store layout and product assortment, and enhance overall operational efficiency.

These insights are invaluable for making data-driven decisions that can lead to increased sales and customer satisfaction.

Benefit of Foot Traffic Analysis

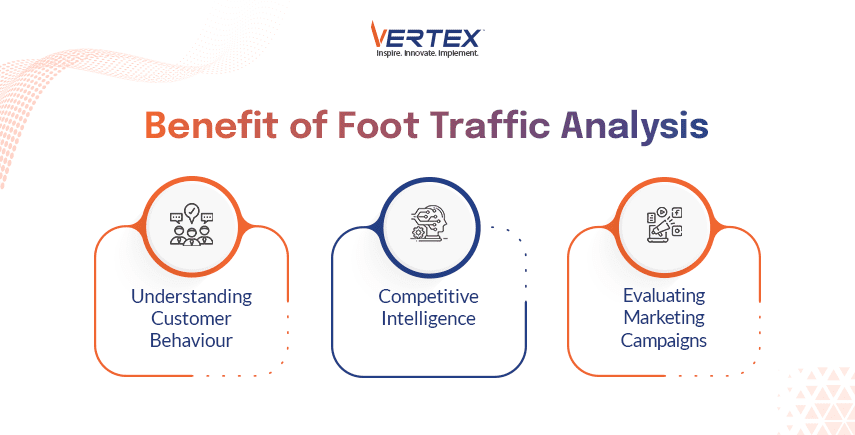
Understanding Customer Behaviour

Gaining insights into how customers interact with your retail space is crucial for strategic decision-making. Foot traffic analysis offers a detailed view of customer behaviour, helping you align your operations with their preferences.

  • Identifying Peak Hours and Days: Analyzing foot traffic data helps pinpoint peak times, enabling retailers to plan targeted staffing and promotions efficiently.
  • Analyzing Customer Journeys: Heatmaps visually represent customer movement, aiding in optimizing store layouts for better alignment with natural customer flow.
  • Measuring Dwell Time: Tracking how long customers spend in specific areas informs decisions on product placement and promotions, tailoring the shopping experience to customer preferences.

Foot traffic analysis provides deep insights into customer behaviour. By understanding when and how customers interact with their stores, retailers can enhance the shopping experience and improve business outcomes.

Evaluating Marketing Campaigns

Effectively assessing the impact of your marketing efforts is key to refining your strategies. Foot traffic data is an invaluable asset in this process, offering a direct measure of campaign effectiveness.

  • Measuring Foot Traffic Uplift: By comparing foot traffic before and after marketing campaigns, retailers can assess the impact of their promotional efforts.
  • Correlating Traffic with Marketing Channels: Analysis can reveal which marketing channels are most effective at driving foot traffic, allowing for more targeted and efficient future campaigns.
  • Optimizing Campaigns Based on Response: The response to various marketing strategies, as indicated by changes in foot traffic, guides the optimization of future campaigns for better engagement and returns.

This approach ensures your marketing efforts are data-driven, maximizing their effectiveness and ROI.

Competitive Intelligence

  • Benchmarking Against Competitors: Comparing your foot traffic data with that of competitors helps identify areas where your store excels or needs improvement.
  • Gleaning Insights from Competitors: Insights drawn from competitors’ foot traffic data can inform strategies for your own store improvements and expansion.
  • Data-Driven Decisions for Store Location and Expansion: Analyzing foot traffic trends assists in making informed decisions about where to open new stores or expand existing ones.

Foot traffic analysis is instrumental for competitive intelligence in retail. It aids retailers in understanding their market position and making informed decisions to stay ahead of the competition.

How to Optimize Your Retail Strategy with Foot Traffic Data

Harnessing foot traffic data effectively can revolutionize your retail strategy, turning every customer step into actionable insight.

Store Layout & Merchandising

Analyzing foot traffic patterns opens a window to how customers interact with your store’s layout and product placement.

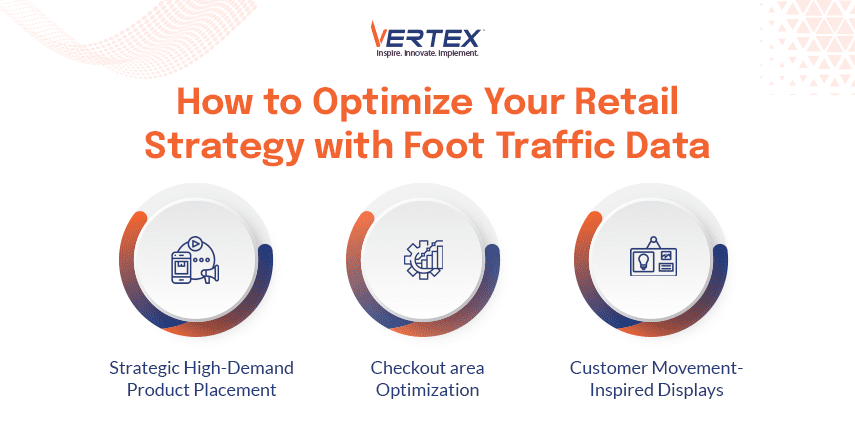
  • Strategic High-Demand Product Placement: Utilize foot traffic data to identify high-traffic areas and place high-demand products strategically, increasing visibility and sales.
  • Checkout Area Optimization: Design your checkout areas to reduce wait times and prevent potential customer drop-offs, enhancing the overall shopping experience.
  • Customer Movement-Inspired Displays: Craft your displays based on the flow of customer movement, making them not just visually appealing but also easily accessible.

Optimizing your store layout and merchandising based on foot traffic data is the key to boosting sales efficiency, ensuring that every square foot of your retail space counts.

Inventory Management

Effective inventory management is essential for meeting customer demand without overstocking.

  • Predicting Peak Demand: Use foot traffic trends to predict peak times, ensuring you are well-stocked for high-demand periods.
  • Overstock Reduction in Slow Areas: Analyze less frequented areas of your store to prevent overstocking items there, optimizing your inventory levels.
  • Assortment Optimization Based on Preferences: Align your product assortment with customer preferences and behaviours indicated by foot traffic data, catering to their tastes and needs.

Effectively leveraging foot traffic insights for inventory management ensures that your stock levels are always aligned with customer demand, reducing waste and maximizing sales opportunities.

Staffing & Service

Optimal staffing ensures that your store operates efficiently and customers receive the best service.

This approach involves scheduling staff based on anticipated foot traffic, ensuring that your team is well-prepared to handle peak times effectively.

During high-traffic periods, deploying additional staff is key to maintaining service quality and keeping customer satisfaction high.

Moreover, training your staff to engage effectively with customers at key touchpoints, as identified through foot traffic analysis, can significantly enhance the customer experience.

Conclusion

Foot traffic analysis is about understanding customer behaviour, preferences, and the effectiveness of your store layout and campaigns.

As retail continues to evolve, leveraging foot traffic data effectively will be key to making informed decisions and staying competitive.

Discover how Vertex Computer Systems can transform your approach to customer engagement and store optimization.

Big Data vs Small Data: Which is Right for Your Business?

In today’s data-driven world, businesses have access to vast amounts of data, ranging from customer data to operational data.

However, with so much data available, it can be overwhelming for businesses to decide which data to focus on and how to make the most of it.

This is where the concept of big data and small data comes in.

Big data refers to the analysis of large, complex datasets that cannot be processed by traditional data processing tools.

It involves processing and analyzing vast amounts of data to uncover patterns, trends, and insights that can help businesses make informed decisions.

On the other hand, small data refers to the analysis of smaller, more specific datasets that are more manageable and can be processed using traditional data processing tools.

So, which is right for your business – big data or small data? In this blog post, we’ll explore the pros and cons of each approach to help you make an informed decision.

Big Data

Big data has become a buzzword in the business world, and many companies are investing heavily in big data analytics to gain a competitive edge.

The primary advantage of big data is the ability to uncover insights that were previously hidden or difficult to find.

With big data, businesses can analyze vast amounts of data from various sources, including social media, website traffic, and customer feedback, to gain a more comprehensive understanding of their customers and business operations.

However, big data comes with its own set of challenges. One of the biggest challenges is managing the sheer volume of data.

Processing and analyzing large datasets can be time-consuming and require specialized tools and skills.

Additionally, big data can raise privacy concerns as businesses collect and analyze vast amounts of personal information from customers.

Small Data

Small data, on the other hand, focuses on specific datasets that are more manageable and can be processed using traditional data processing tools.

Small data provides businesses with a more focused and targeted approach to data analysis, enabling them to make informed decisions based on specific datasets.

One of the advantages of small data is that it’s more accessible to small and medium-sized businesses that may not have the resources to invest in big data analytics.

Additionally, small data can be processed and analyzed quickly, providing businesses with real-time insights into their operations.

However, small data has its own limitations. Since it focuses on specific datasets, it may not provide businesses with a comprehensive understanding of their operations or customers.

Additionally, small data may not be suitable for businesses that operate in complex industries or deal with large amounts of data.

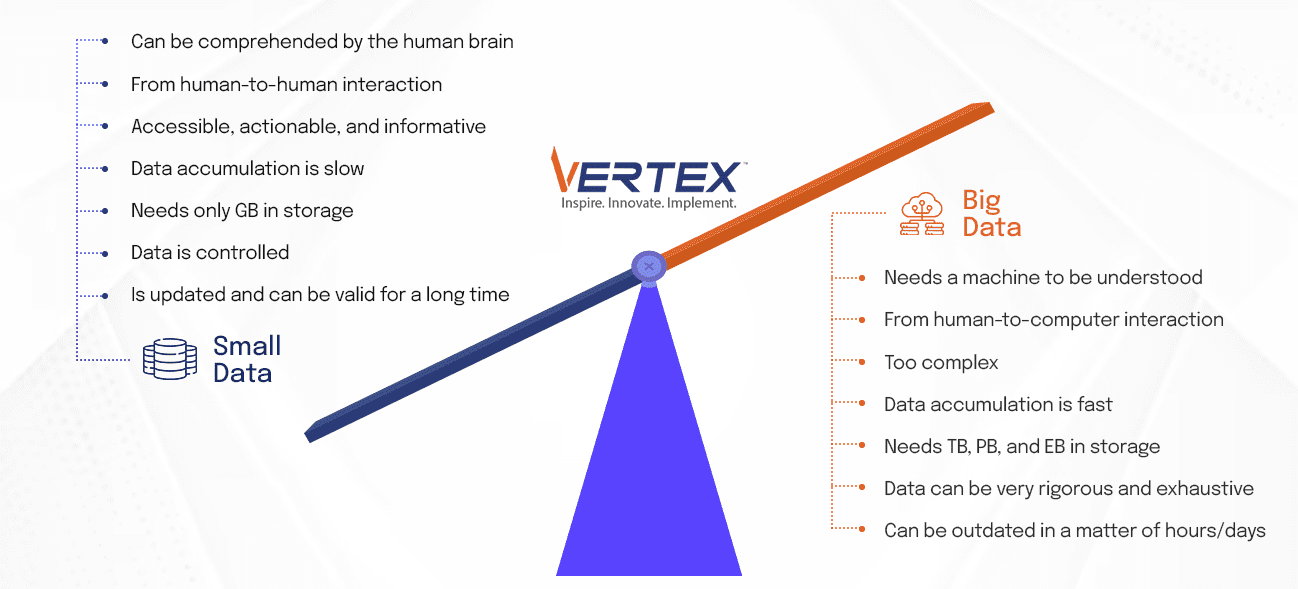
Small Data and Big Data Comparison by Vertex


Which is Right for Your Business?

When it comes to choosing between big data and small data for your business, there are a few key factors to consider.

One of the most important considerations is the size and complexity of your business operations.

If your business operates on a larger scale and deals with vast amounts of data from multiple sources, then big data may be the right choice for you.

Big data can help you gain a comprehensive understanding of your customers and operations by analyzing large, complex datasets.

This can help you identify patterns and trends that would otherwise be difficult to find, allowing you to make more informed decisions.

However, big data is not without its challenges. It can be time-consuming and costly to process and analyze large datasets, and it requires specialized tools and expertise.

Additionally, the sheer volume of data can raise privacy concerns and regulatory issues.

On the other hand, if your business operates on a smaller scale and deals with more manageable datasets, then small data may be a better fit.

Small data can provide you with more targeted insights into your operations and customers, allowing you to make informed decisions based on specific datasets.

One of the main advantages of small data is that it’s more accessible to businesses with limited resources.

Small data can be processed using traditional data processing tools, making it a cost-effective option for smaller businesses.

However, small data may not be suitable for businesses that operate in complex industries or deal with vast amounts of data.

It may not provide a comprehensive understanding of your customers and operations, which could limit your ability to make informed decisions.

In conclusion, the choice between big data and small data ultimately depends on your business needs and goals.

While big data can provide valuable insights into trends and patterns, small data may be more effective for identifying specific customer preferences and behaviours.

At Vertex, we understand that navigating the world of data can be challenging.

That’s why we offer a comprehensive suite of data analytics solutions designed to help businesses extract insights from both big and small data.

Our team of experts can work with you to identify your business goals, gather the right data, and develop customized data models to help you make informed decisions and drive growth.

With Vertex’s data analytics solutions, you can gain a deeper understanding of your business, uncover hidden patterns and trends, and identify opportunities to optimize your operations and drive growth.

Whether you’re looking to improve your customer experience, optimize your supply chain, or streamline your operations, Vertex has the expertise and tools you need to succeed.

Don’t let data overwhelm you. Contact Vertex today to learn more about how our data analytics solutions can help you make sense of big and small data and make informed decisions for your business.

loader
Vertex Computer Systems is Hiring!Join the Team »
+