The world is struggling to restore the balance we once had, nature is suffering because of our actions, and climate change is a byproduct. We might have a chance if we take sustainability a bit seriously.
Fortunately, a lot of organisations have boarded the green earth wagon and are trying to heal the damage. Similarly, digital transformation is helping businesses transform at a remarkable speed. When you combine sustainability and digital transformation, you get a unique opportunity that leverages technology to forge a greener and more sustainable future.
In this article, we will learn how digital transformation can be the medium through which we will move towards a sustainable Earth and how services like artificial intelligence, IoT of things, and data analytics will bring about the change we are looking for.
Key Areas Where Digital Transformation Drives Sustainability
Digital transformation is a multistep process that affects not just one but different aspects of an organisation, some of which I have mentioned below.
- Resource Optimization:
Digital tools can measure resource optimization much better than we humans. IoT sensors can track the usage of energy and raw materials, and with AI algorithms, you can optimise material usage for better manufacturing. There are smart grids for stable energy distribution, through these controls, there is minimal waste with maximum yield. This helps ensure that we are properly using our finite resources, and it is also compliant with the argument raised by UNEP during the discussion on digitalization for sustainability.
- Supply Chain Transparency and Traceability:
Transparency and traceability are important when you are involved in online transactions and businesses. Blockchain and advanced data analytics provide visibility across many complex supply chains. This enables the business to track the environmental footprint of its products, identify areas for improvement, and ensure sustainable sourcing of materials. This contributes to more responsible production.
- Circular Economy Enablement:
If we transition towards a circular economy where we connect waste streams to potential reusers or recyclers, this will optimize the product lifecycle and will nurture new business models. Digital platforms can help you do that and also sell models like product-as-a-service. While we transition to this, data analytics can find us opportunities like remaufacturing, repair, and recycling, and maximizing the value of materials.
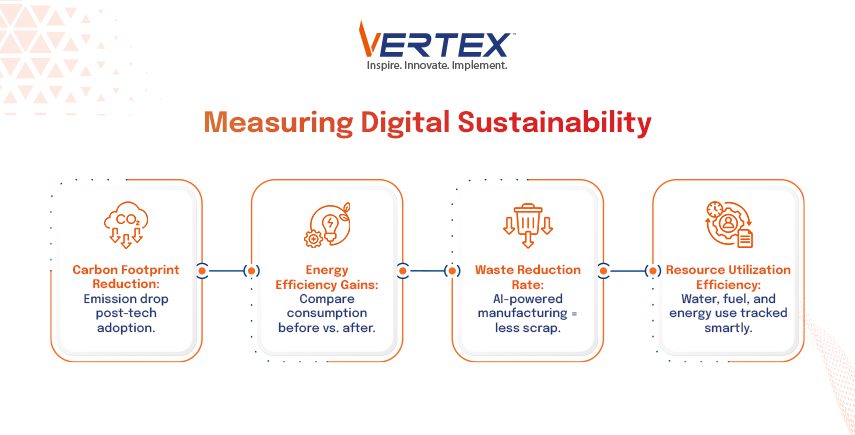
Green Metrics & KPIs: How to Measure Digital Sustainability
For running a successful and efficient business, establishing KPIs is crucial. These KPIs, or Key Performance Indicators, are a medium through which we can track progress and see if the resource is useful or not. The green metrics not only include financial indicators but go beyond them. For example –
- Carbon Footprint Reduction: This measures the decrease or increase in greenhouse gas emissions that have occurred after the implementation of the digital initiatives. Digital initiatives have included remote work policies or optimized logistics services.
- Energy Efficiency Gains: This KPI measures the amount of energy consumed in buildings or industrial manufacturing plants. Then it will compare it to see what the difference is after implementing the digital services.
- Waste Reduction Rates: This monitors the decrease in the material waste achieved after the AI-powered optimization or circular platforms.
- Resource Utilization Efficiency: This measures how effectively raw resources, such as water and fossil fuels, are used, thanks to digital tools and management systems.
The Role of Data in Sustainable Innovation
Without data, we are blind; data is key in transitioning to a sustainable, innovative lifestyle. All the raw data that is being generated by the IoT devices, supply chains, and environmental monitoring provides raw materials that are then processed into useful insights . There are big data analytics firms and software that can identify patterns in this raw data. Based on these patterns and insights, they make suggestions that help us optimize our overall workflow. For example, AI can analyze the weather patterns and energy consumption data to optimize the energy grid for potential environmental risks based on historical data.
Digital Technologies for Sustainability
If we were to move toward a digitally enabled sustainable future, then some technologies are paramount, and we need to learn about them.
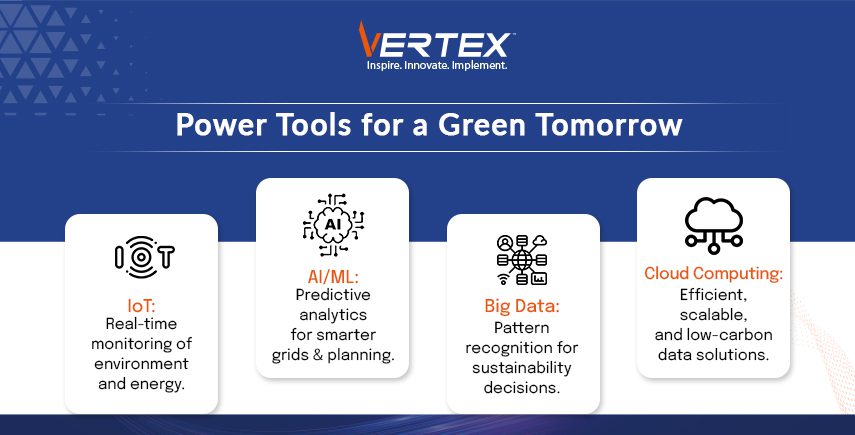
- Internet of Things (IoT): With IoT, you can monitor anything in real-time, including environmental conditions, resource consumption, and even asset performance. Through IoT you get all the raw data you need for better optimization of your organisation or business.
- Artificial Intelligence (AI) and Machine Learning (ML): The computing power of predictive analytics and resource management is crucial for resource management, and we also have to optimize the energy grids, and this all is possible with AI and machine learning.
- Big Data Analytics: All the raw datasets are processed and analyzed using this to identify trends and optimize the supply chain for sustainability and make data-driven decisions.
- Cloud Computing: With cloud computing, you get a scalable and energy-efficient system for a huge amount of data storage and processing without increasing your carbon footprint.
Benefits of Digital Transformation for Sustainability
The benefits of adopting digital transformation for sustainability are several; some of them I have listed below.
- The biggest benefit is the reduction in environmental impact, thanks to lower emissions, minimized waste, and resource conservation. This also leads to lower operation costs.
- Digital tracking helps you keep track and maintain accountability of your products and services.
- When you process all the raw data fed by the IoT devices, you get a better picture when that data is processed. With the processed data, you can make data-driven insights that will fuel the development of sustainable solutions.
- Once you adopt digital monitoring and reporting of the data, you automatically become more compliant with regulatory guidelines.
Challenges and Opportunities
So far, we have discussed the benefits and possibilities that will emerge with the growth of a sustainable future driven by digitalization. However, we need to discuss the real-life hurdles and challenges we have to face before and during the transition. Primarily, the investment in digital infrastructure and secondary is the lack of skilled personnel to handle the technology and devices involved in the process. There are also data privacy and security concerns that are linked to the collection and analysis of such a vast amount of data.
However, there is always a silver lining, and the silver lining in this is the opportunities that come with these challenges. Since this is a new, growing market with many challenges, new companies and service providers will emerge to make tasks easier for businesses and organisations.
Case Studies and Examples
We can see the examples of digital transformation driving sustainability all over the globe, and especially in India.
- In agriculture, we are now using IoT sensors and AI-powered analytics that help optimize water usage, fertilizer application, and even pest control. This all leads to better and sustainable farming practices.
- With the help of smart grids, we are able to optimize the energy distribution, all the while increasing the use of more renewable energy and reducing energy waste.
- Blockchains enable customers to track the origin and environmental impact of the goods they buy, allowing consumers to make informed choices.
- A lot of cities are now transforming into smart cities with the use of digital technologies; they are able to optimize the traffic flow, manage the waste efficiently, and recycle more.
These examples are the real-life impact that our nation and the world are experiencing thanks to the digital transformation and the much-needed push towards a sustainable future.
A Digitally Driven Path to a Sustainable Future
We have discussed the benefits, impact, and challenges of a sustainable future led by digital transformation. We learned about how the data that we generate in our day-to-day tasks can be optimized and processed to give us insights that not only smoothens our overall workflow but also enforce sustainability by recycling, waste management, inventory management, and much more. This article talks about how we can achieve a sustainable future if we simply allow data-driven insights to work their magic.